County Profiles
In preparation for the short legislative session, the Coalition has been hard at work updating our County Profiles, and they are now live on the website! For those of you familiar with our profiles, there are a few changes this year. On the back page, you will notice two new data points:
- eviction filings; and
- foreclosures.
These were added to provide some more texture to the need in each county. To make room, we removed the legislative ask. Since so many of you were using these profiles in many different contexts, we wanted them to be useful outside of the North Carolina legislative session.
You will see that that nearly 1.2 million households in the state are still cost-burdened, and in 2016 more than 166,000 families saw an eviction filing. Explore our map of North Carolina and see how the housing need differs from county to county. You can also access a spreadsheet of the underlying data.
Nearly 1.2 million households in the state are still cost-burdened, and in 2016 more than 166,000 families saw an eviction filing
Mapping Housing Insecurity
In addition to updating the county profiles, we have also developed a mapping tool in partnership with the NC State University Geospatial Information Science and Technology Program. Like many of you, we have been paying particular attention to evictions ever since we read Matthew Desmond’s book “Evicted.” While trying to get a sense of what the eviction crisis looked like in North Carolina, we asked asked the following questions of each county:
- How many families struggle to afford their rent?
- How many families face an eviction filing each year?
- How many families struggle to afford their mortgage?
- How many families face a foreclosure each year?
We put all the answers together and gave each county a “Housing Insecurity” score ranging from moderate to severe. You can read more about the methodology here.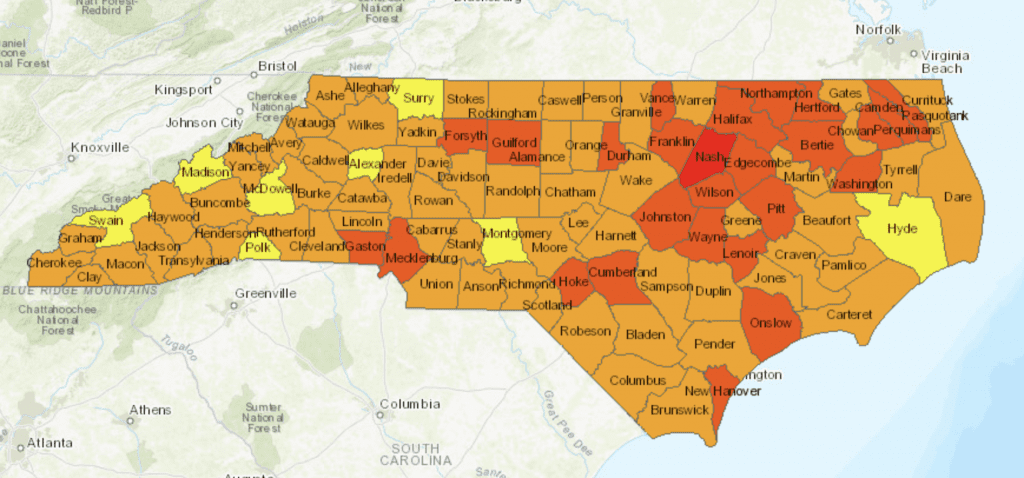
As you can see from the map, the epicenter of the crisis is Nash and Edgecombe Counties. This is driven in large part by their abnormally high eviction filings as compared to the number of cost-burdened renters. The number of eviction filings in Edgecombe County is 81% of the number of cost-burdened renters. In Nash County, that number is 77%. The next highest rate in North Carolina is Wilson County at 48%.
The number of eviction filings in Edgecombe County is 81% of the number of cost-burdened renters. In Nash County, that number is 77%.
In addition to “Housing Insecurity,” you can also break the map down further and see which counties have the most cost-burdened renters, or which counties are issuing more eviction filings compared to the number of cost-burdened renters. Explore the mapping tool here.
Many thanks to Donta’ Fairey, Amber Litka, and Anne Ehlers for their tireless work on these projects. We would appreciate your feedback on this tool and how we might continue to improve it. Please send feedback to sgunter@nchousing.org.