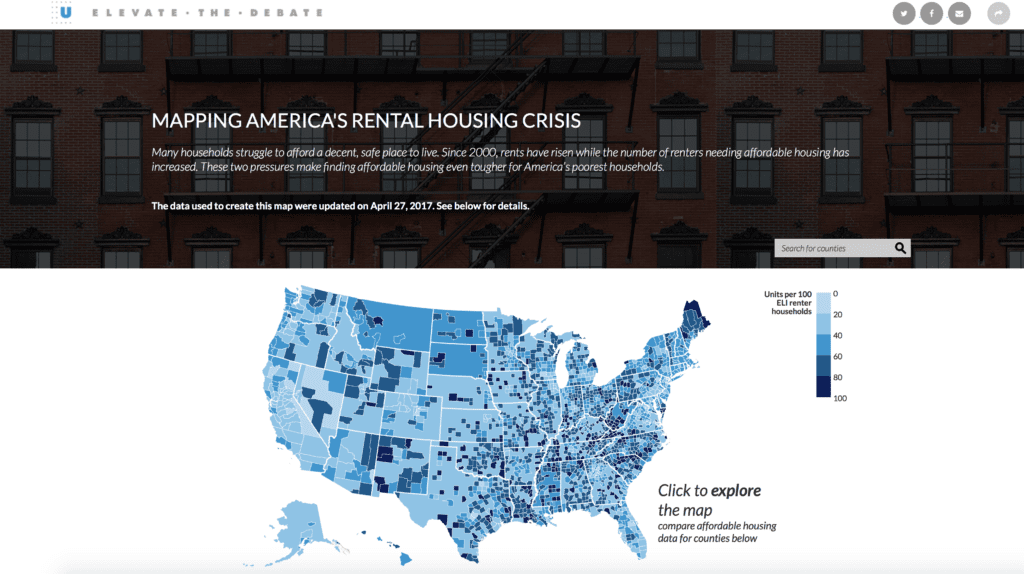
Many households struggle to afford a decent, safe place to live. Since 2000, rents have risen while the number of renters needing affordable housing has increased. These two pressures make finding affordable housing even tougher for America’s poorest households. This map explores the housing gap for extremely low income households by county.
The figures in this analysis represent a best estimate of the affordable rental housing gap and federal assistance for extremely low-income (ELI) renter households at the county level in the United States. The data analyzed come from multiple sources:
- the American Community Survey (ACS) Public Use Microdata Sample from the Census (via the Integrated Public Use Microdata Series from the Minnesota Population Center);
- the US Department of Housing and Urban Development (HUD’s) Public and Indian Housing Information Center and Tenant Rental Assistance Certification System;
- the HUD Section 8 Income Limits;
- the US Department of Agriculture’s (USDA’s) Rural Housing Service; and
- ACS pre-tabulated data from the Census.
The data on HUD-assisted housing represent a best estimate of the total number of HUD-subsidized ELI households. We include only those programs for which we can obtain data from HUD—namely, Public Housing, Housing Choice Vouchers, Moderate Rehabilitation, and Section 8 New Construction, Substantial Rehabilitation, and other Multifamily—and only those recipients who are not rent-burdened.
The data on rental housing programs funded through the USDA are counts of ELI households living in USDA Section 515 properties and receiving USDA Section 521 Rental Assistance.
In a small number of counties, the analysis produces negative estimates for adequate, affordable, and available units when federal assistance is removed. These estimates are not negative in reality but are likely a result of sampling error from the ACS. To adjust for this error, we set the unassisted unit count to zero and adjust all affected variables accordingly. This adjustment affects only this small subset of counties and has no effect on the national estimates. For more detail on the methodology, click here.
For more information on different data sources when analyzing affordable housing, visit our website.


