Yesterday afternoon the North Carolina Housing Finance Agency announced the 2017 Housing Credit Awards. Awards went to 32 tax credit projects in 25 counties totaling 2,150 units and 11 tax exempt bond projects totaling 943 units. NCHFA was able to use all $20 million of its Workforce Housing Loan Program appropriation, showing that there is still room to grow the program to serve more North Carolinian families in need of affordable rental housing.
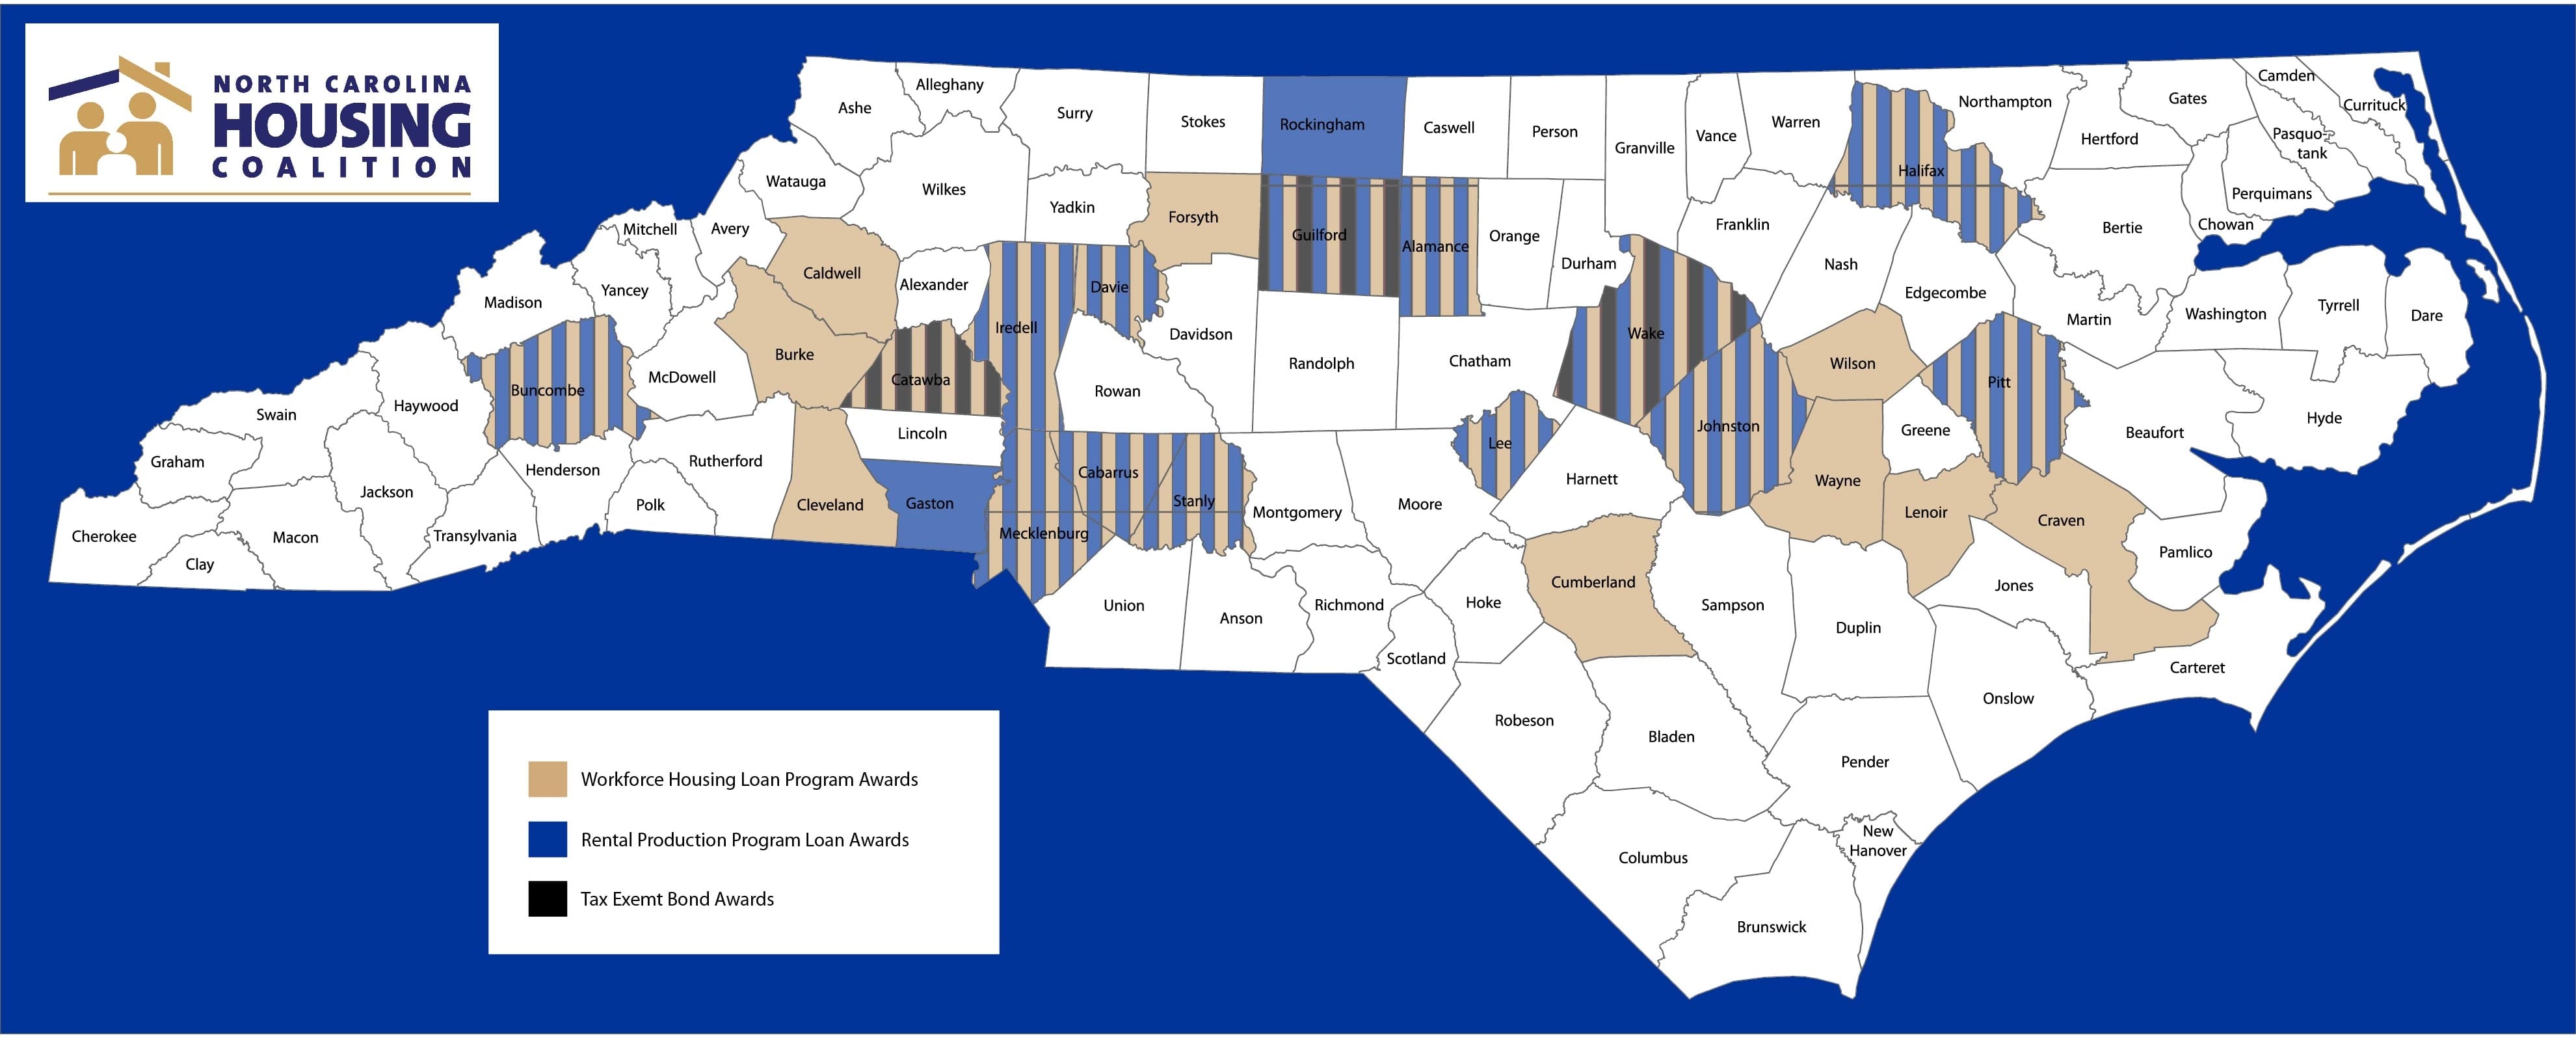
Below is a breakdown by county of the number of projects, amount of subsidy, and the number of affordable units that will be built.
| County | Tax Credit Projects | Tax Exempt Bond Projects | Total Projects | Federal Housing Credits | RPP Loan Amount | WHLP Loan Amount | Bond Volume | Rehab Units | New Units | Total Units |
| Alamance | 0 | 1 | 1 | $795,600 | $800,000 | $750,000 | $0 | 0 | 80 | 80 |
| Buncombe | 0 | 1 | 1 | $890,300 | $1,000,000 | $250,000 | $0 | 0 | 95 | 95 |
| Burke | 0 | 1 | 1 | $625,350 | $0 | $750,000 | $0 | 0 | 60 | 60 |
| Cabarrus | 0 | 2 | 1 | $1,147,337 | $1,300,000 | $500,000 | $0 | 48 | 80 | 128 |
| Caldwell | 0 | 2 | 1 | $930,750 | $800,000 | $1,500,000 | $0 | 44 | 66 | 110 |
| Catawba | 1 | 1 | 1 | $826,994 | $0 | $1,500,000 | $3,500,000 | 68 | 72 | 140 |
| Cleveland | 0 | 1 | 1 | $823,300 | $0 | $1,500,000 | $0 | 0 | 80 | 80 |
| Craven | 0 | 1 | 1 | $734,800 | $0 | $1,500,000 | $0 | 0 | 68 | 68 |
| Cumberland | 0 | 1 | 1 | $917,000 | $0 | $1,500,000 | $0 | 0 | 96 | 96 |
| Davie | 0 | 1 | 1 | $710,311 | $800,000 | $250,000 | $0 | 0 | 66 | 66 |
| Forsyth | 0 | 1 | 1 | $1,000,000 | $0 | $250,000 | $0 | 0 | 96 | 96 |
| Gaston | 0 | 1 | 1 | $649,200 | $1,000,000 | $0 | $0 | 0 | 58 | 58 |
| Guilford | 9 | 1 | 1 | $3,018,126 | $800,000 | $250,000 | $38,000,000 | 645 | 60 | 705 |
| Halifax | 0 | 1 | 1 | $563,000 | $800,000 | $1,000,000 | $0 | 0 | 50 | 50 |
| Iredell | 0 | 1 | 1 | $748,898 | $800,000 | $250,000 | $0 | 0 | 66 | 66 |
| Johnston | 0 | 1 | 1 | $652,950 | $800,000 | $250,000 | $0 | 0 | 64 | 64 |
| Lee | 0 | 1 | 1 | $605,049 | $800,000 | $250,000 | $0 | 0 | 60 | 60 |
| Lenoir | 0 | 2 | 1 | $1,112,824 | $0 | $2,000,000 | $0 | 57 | 60 | 117 |
| Mecklenburg | 0 | 3 | 1 | $2,215,586 | $800,000 | $750,000 | $0 | 0 | 203 | 203 |
| Pitt | 0 | 1 | 1 | $565,296 | $800,000 | $250,000 | $0 | 0 | 56 | 56 |
| Rockingham | 0 | 1 | 1 | $488,456 | $730,000 | $0 | $0 | 66 | 0 | 66 |
| Stanly | 0 | 1 | 1 | $740,000 | $800,000 | $1,500,000 | $0 | 0 | 80 | 80 |
| Wake | 1 | 3 | 1 | $2,835,041 | $720,000 | $500,000 | $23,000,000 | 278 | 127 | 405 |
| Wayne | 0 | 1 | 1 | $675,000 | $0 | $1,500,000 | $0 | 0 | 72 | 72 |
| Wilson | 0 | 1 | 1 | $737,300 | $0 | $1,250,000 | $0 | 0 | 72 | 72 |
| TOTAL | 11 | 32 | 43 | $25,008,468 | $13,550,000 | $20,000,000 | $64,500,000 | 1206 | 1887 | 3093 |
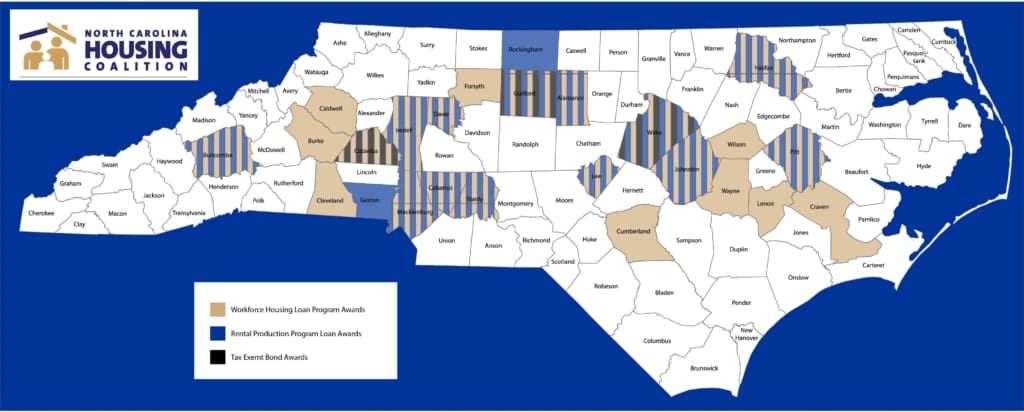
Below you can also see a map showing the geographic distribution of federal and state resources.


